One of the biggest rules for your online business is to simply never make changes “just because” you might think it will help. You should only be making changes based on the data you have in front of you and the statistical evidence that shows something is not working. If you can accurately understand your website data and see how visitors are using your site (or not) then it just becomes a game of continuous improvement. Keep what works and trying to improve what isn’t.
The hardest part is trying to understand your data and at times you’ll need to view your data from multiple angles to make the right decision for your website. Heatmap tracking is one highly effective method of representing your data visually to help you understand things such as:
- Where visitors are clicking
- How far visitors are scrolling
- Where is the mouse moving
- What areas of your website are hot vs areas that are cold. i.e. very little movement/clicks
- Are visitors clicking on your call to action.
When combined with Google analytics and Google URL builder you start building a powerful toolset for improving conversions.
What is Heatmap tracking?
Heatmap tracking is software that presents a visual representation about how visitors are engaging with your website through clicks, mouse movement, scrolling and much more. If you’ve ever seen infra-red cameras that show heat movement, exactly like you see in the movies, then there are many similarities. Let’s take a look at an example.
![]()
As you can see above the areas in red are the areas of my site that are used the most. The more frequently the mouse moves in this area the colour of the heatmap will change to red indicating it’s hot. However in other areas which are less used the colour will be a lighter blue to show that the area is cold and less frequently used.
Types of Heatmap Tracking
Now the terminology can differ between heatmap tracking tools and in this instance I’ll be using the terminology from ClickTale. I do however recommend both CrazyEgg and ClickTale and feel they both offer a valuable and similar service. Clicktale however offering the slightly more advanced method of being able to record live videos of your visitors using your site (incredibly addictive, beware and use at your own peril).
Each of the following heatmap tracking options are powerfully combined with Google’s URL builder. The URL builder allows you to create unique URLs to track visitors from numerous referral locations. For example you might wish to track a particular adwords campaign throughout your website, even down to unique keywords, and heatmap tracking can allow you to break down your results to improve conversions of different types of visitors not just your global visitors.
Mouse Move
Mouse move tracks your visitors mouse moment across your website and visually represents in a hot (red) and cold (ice blue) heatmap. It’s been shown through research that there is an 84%- 88% correlation between mouse and eye movements. It’s important for your call to action to be contrasting in colour because your hand followers the eye and you want eyes on your most important areas of your site.
Click Map
Click maps show exactly where visitors are clicking and makes the area hot (red) where your website receives the most. It’s likely that in order for you to achieve your website conversion goals your visitors will need to click key areas of your site. Research has shown that the colour, text, size and many other characteristics can increase the number of clicks website objects received.
Mouse Scroll
Mouse scroll allows you to understand how far visitors are scrolling down a particular page. You’ll find that the top part of your page, called above the fold, is always viewed when a visitors lands on your page however the remainder of your page is highly dependant on engaging content to ensure that the visitor reaches the bottom. If your most important content is down the bottom but nobody is reaching it then you might need to shorten your page, create more engaging content or even move your critical content into the above the fold section.
Attention
The attention heatmap shows you what visitors care about most. It shows you how much attention, i.e. viewing time, a section of your page receives. This can be another useful report for showing what visitors care about the most and how you might consider changing other areas of your site that are continuously passed.
Use Heatmaps to Drive Traffic to Your Goals
An important fact to remember with heatmaps is that you need to give them some time to show realistic data before you start changing your website. 10 visitors is not enough, no really, it’s simply not enough to make a judgement call on your website. You should be looking at larger number of visitors between 500 – 1000 or even much more depending on the number of visitors your site receives.
There are some important areas of your site that you can use to maximise its potential based on the results of the different types of heatmap reporting tools mentioned above.
Maximising Above the Fold Content
Above the fold content is the top part of your website page that is always visible when a visitor lands on your page. When you review your mouse scroll you’ll begin to understand that the chance of a visitor seeing something important beneath the fold greatly reduces the further down the page the user has to scroll. Make use of the above the fold section of your page and ensure that when visitors land your call to action and website goals are always at the top of the page.
Modify Colour & Contrast
As mentioned previously the hand tends to follow where the eyes are looking. Therefore it makes sense to use high contrast and vibrant colours to catch the attention of the visitors eye. Encourage them to read your call to action and to complete the action you want them to take. Study has also show that different colours can provide your visitors with different emotions so experiment with finding a colour that converts best for your audience.
Improve Call to action wording
The wording of your call to action can significantly increase the amount of clicks your content receives. If your most important areas are not being clicked upon then try to change the wording or highlight the benefits more clearly for your audience. The different between “create” and “start” can be significant in terms of a visitor thinking that the process might be laborious to create something versus simply starting. The same can be said as “click here” vs “Yes! Let’s Start Today”. Again research has shown that presenting users with a simple yes / no option can be highly effective also.
Google Search Result Heatmaps
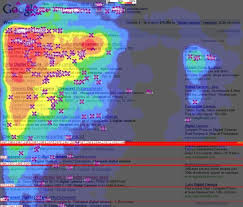
To finish up I thought i’d have a bit of fun that shows the value of a top #1 or #2 spot in Google. Again the obsession tends to fall on rankings but it’s not about ranking on one keyword it’s about spreading your voice and being everywhere. Imagine if you could be ranked #1 or #2 across many different keyword terms and phrases, this would be incredibly powerful rather than focusing on just one keyword.
We provide heatmap and conversion optimisation services as part of our seo packages. If you’re keen on pushing the sales and leads that your website generates then get in touch with us today and let’s chat about how we can help. How have you used heatmaps successfully on your website?